What is a “Dimension” in Google Analytics?
In the vast and complex universe of internet analytics, one term that frequently causes much confusion is ‘dimension’. This is a term that originates from Google Analytics, one of the most powerful tools used in understanding web traffic, user behavior and overall website performance. This article aims to delve into these little-understood aspects of Google Analytics and shed some light on what dimensions really mean and how they are crucial in analyzing your website’s performance.
Every interaction that happens on a website produces measurable data accessible via Google Analytics. These sets of data are categorized into specific characteristics known as ‘dimensions’. They provide extensive qualitative context to your data — in other words, they tell you more about your numerical data by essentially “describing” them. The goal here is to comprehend the role of dimensions in Google Analytics and how you can use them to yield insightful information about your website’s dynamics.
The term ‘dimensions’ in this context can be somewhat elusive without proper understanding. A concrete grasp of its concept and functionality allows more targeted and effective data analysis. Read on as we demystify the concept of dimensions, explore its various types and why it is an essential component in deriving meaningful interpretations in Google Analytics.
Grasping the Concept of Dimensions in Google Analytics
When navigating the landscape of Google Analytics, one crucial concept that users must comprehend is the idea of dimensions. These dimensions, simply put, are recognizable traits connected with user interactions and help to provide a comprehensive analysis of your website or app’s performance. They portray the essential “who, what, where, when, and how” of user engagements with your site.
By understanding dimensions, users unveil a detailed narrative about their website performance, visitor behavior, and the effectiveness of their strategies. This valuable data can serve as the basis for decision-making, strategy adjustment, and specific goal targeting for businesses and content creators alike.
Characteristics and Functions of Dimensions
Dimensions in Google Analytics embody the descriptive characteristics of the data that gets captured. These features provide crucial information about sessions, users, and actions. That could include the users’ geographical region, the source they came from, the type of device they’re using, or the pages they viewed.
The enriched data obtained through these dimensions consequently helps the Google Analytics users identify segments of audiences that respond most effectively to their strategies. This can, in turn, help in optimizing strategies to enhance overall performance and ROI.
Types of Dimensions in Google Analytics
- User Dimensions: These dimensions provide insights into your users’ specifics, such as location, age, gender, etc.
- Session Dimensions: These dimensions offer information about a user’s particular visit, like the duration of the session, source, or device used.
- Behavior Dimensions: These demonstrate user behaviors, such as page views, bounce rate, and site speed.
- Conversion Dimensions: These tell about goal completions or commerce activities.
In conclusion, understanding dimensions and how to use them within Google Analytics can dramatically enhance a website or app’s analysis, resulting in well-informed strategic decisions that drive success.
Understanding Dimensions in Google Analytics
Dimensions in Google’s Analytics system play a crucial role in the way data is categorised and viewed. They provide a way to group and interpret your data in a meaningful way, which will help you to better understand and evaluate your website’s performance.
In essence, a dimension within this analytics platform is a descriptive element or attribute of data. Dimensions can include information like the city from which a website visitor is connecting, the type of device used to access the site, or the specific page they are viewing.
A deeper look at dimensions
Dimensions are the categories of data that Google Analytics provides. Each dimension represents a certain attribute of a user’s interaction with your website. For example, the ‘Browser’ dimension will tell you which web browsers your viewers are using to visit your site.
The power of dimensions in Google Analytics lies in their ability to filter and segment data. By applying dimensions to your reports, you can focus on specific subsets of data to gain a more precise understanding of what’s happening on your site. This will help you make better, data-driven decisions related to your marketing strategy.
- Demographic dimensions: These include details like age, gender, and language of your site visitors.
- Behavior dimensions: These contain data related to how users interact with your site, such as the number of sessions, page views, and bounce rate.
- Geographic dimensions: These can show you where in the world your users are, down to city level.
- Technology dimensions: These include details like the users’ operating system, browser, and screen resolution.
Through the use of these different dimensions in Google Analytics, you can gain valuable insights into your site’s performance and user behavior, helping you to make key business decisions based on clear, comprehensive data.
| Aspect | Description | Key Features | Benefits | Considerations |
|---|---|---|---|---|
| Dimensions Defined | Dimensions in Google Analytics are attributes or characteristics of user behavior, actions, or sessions. | – Qualitative data. – Describe user interactions. | – Provide context to quantitative metrics. – Offer insights into user behavior. | – Varied dimensions based on tracking configuration. – Proper dimension selection is crucial. |
| Standard Dimensions | Standard dimensions are predefined in Google Analytics, such as “Source/Medium” or “Device Category.” | – Commonly used across Google Analytics reports. | – Easy to access and understand. – Provide baseline data. | – May not cover all dimensions of user behavior. – Limited customization. |
| Custom Dimensions | Custom dimensions allow you to define and track specific data unique to your business goals. | – User-defined and based on business objectives. | – Tailored measurement of unique user interactions. – In-depth insights. | – Requires configuration and setup. – Custom dimensions must align with business goals. |
| Data Types | Dimensions can represent various types of data, such as text (e.g., “Page Title”) or categories (e.g., “Event Category”). | – Text dimensions describe specific user interactions. – Category dimensions group data into predefined sets. | – Comprehensive data representation. – Aids in context-based analysis. | – Proper dimension choice for specific analysis is essential. |
| Data Availability | The availability of dimensions depends on the tracking and data configuration in Google Analytics. | – Dimensions vary based on tracking code and configuration. – Some dimensions may require specific events or goals. | – Provides context for user interactions. – Helps in tracking specific user behavior attributes. | – Incomplete or inconsistent tracking may lead to missing or inaccurate dimensions. – Consistent configuration is critical. |
Understanding the Function of Dimensions in Evaluating Website Activity
In the realm of Google Analytics, dimensions play a crucial position in analyzing patterns, functionalities, and user behavior on a website. They comprise categorical attributes and characteristics that are assigned to every single interaction, offering valuable insights into the particular elements triggering user engagement or user detachment.
Simply put, dimensions act as details that describe your data. For instance, it could be the geographical location of your site visitors, the browsers they use, the social media channels leading them to your site, or even how long they spend interacting with your website.
Impact of Dimensions in User-Interaction Monitoring
Within Google Analytics, dimensions provide a basis for user-centric data analysis. These dimensions take the complex user data and break it down into understandable metrics for a more cohesive analysis. They assist in exploring how site elements meet or miss your set objectives, and the ways in which they attribute to user interaction. Hence, dimensions have a direct impact on decision-making frameworks that influence strategies for site optimization and increased engagement.
For example, the dimension named ‘browser’ allows you to see the overall performance of your website on different web browsers. Hence, dimensions are oriented around offering a multilayered understanding of user behavior on your website.
- City: This dimension records the cities from which the site traffic originates.
- Source/Medium: This reports the origin of the site traffic – organically, through direct search, social media, etc.
- Session Duration: This tracks the length of a typical user session on your site, aiding in the assessment of user engagement.
Finally, the real benefit of implementing site behavior analysis through dimensions is the ability to answer why your site behaves the way it does. It determines the user patterns, preference tendencies, and then chalks out a strategy to enhance their experience and optimize the conversion rate.
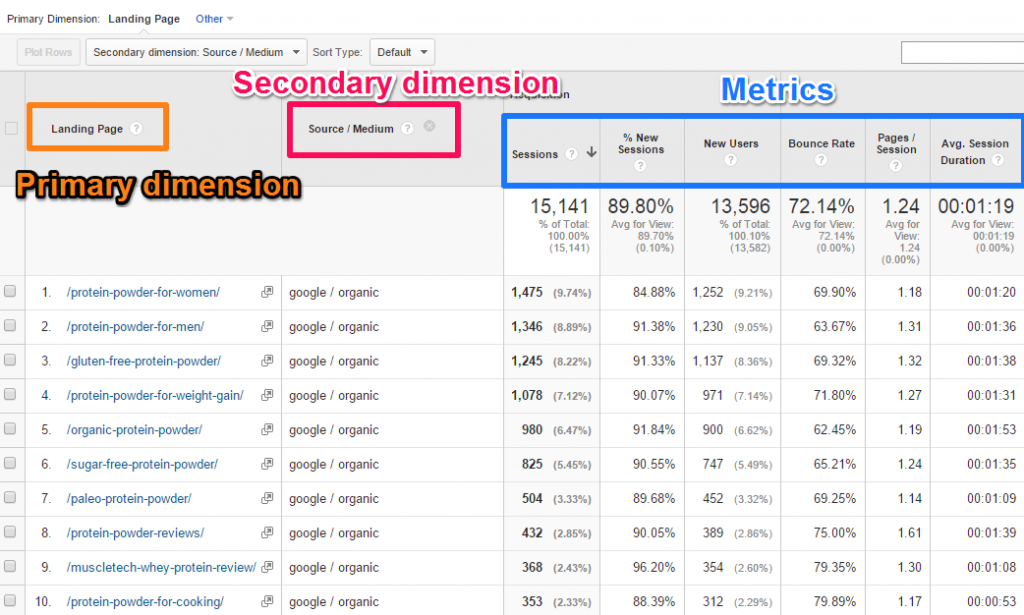
Primary and Secondary Dimensions in Google Analytics
The world of Google Analytics is deep and complex, with multiple facets that help in data analysis. One such facet is ‘dimensions.’ These are qualities or characteristics of data that provide a certain perspective to it. Essentially, dimensions are helpful to create an authentic context around the data being analyzed.
Google Analytics uses various types of dimensions to provide a detailed understanding of user behavior and interactions. Each dimension has a specific way of categorizing the data, thus offering different viewpoints for a robust data analysis. The list of dimension types is extensive, but we will explore some critical categories below:
Primary Types of Dimensions in Google Analytics
- User-level dimensions: These dimensions offer insight into the behaviors and traits of users on your website. For example, the country from where most users are visiting, the language they speak, etc.
- Session-level dimensions: These help to analyze individual user sessions on your website. Factors like session duration, the total number of sessions per user, and pages per session are some aspects covered under this.
- Page-level dimensions: These scrutinize particular web pages on your site. They provide details regarding the performance of specific pages, such as page views, bounce rate, exit rate, etc.
- Event-level dimensions: These concern specific actions taken by users during a session. Clicks on contact forms, downloads, video plays, link clicks are some instances of this type of dimension.
Understanding these categories of dimensions forms the crux of Google Analytics’ power. It allows businesses and marketers to extract the necessary insights from user behavior and accordingly optimize the website performance.
Procedure for Configuring Dimensions in Google’s Analytical Platform
Setting up attributes, also referred to as dimensions, within Google Analytics allows users to gather more comprehensive data concerning online users’ engagement. This kind of data provides analysts with crucial insights into the behavior of visitors on a website, which in turn helps to make informed decisions on how to improve the content and the design of the site.
Implementing dimensions provides additional granularity to your data, as you can track specific parameters instead of just the generic metrics provided by default. Whether it’s information about characteristics of users, their session details, or tangible interaction metrics, all these can be captured using tailored dimensions.
Steps for Establishing Dimensions within Google Analytics
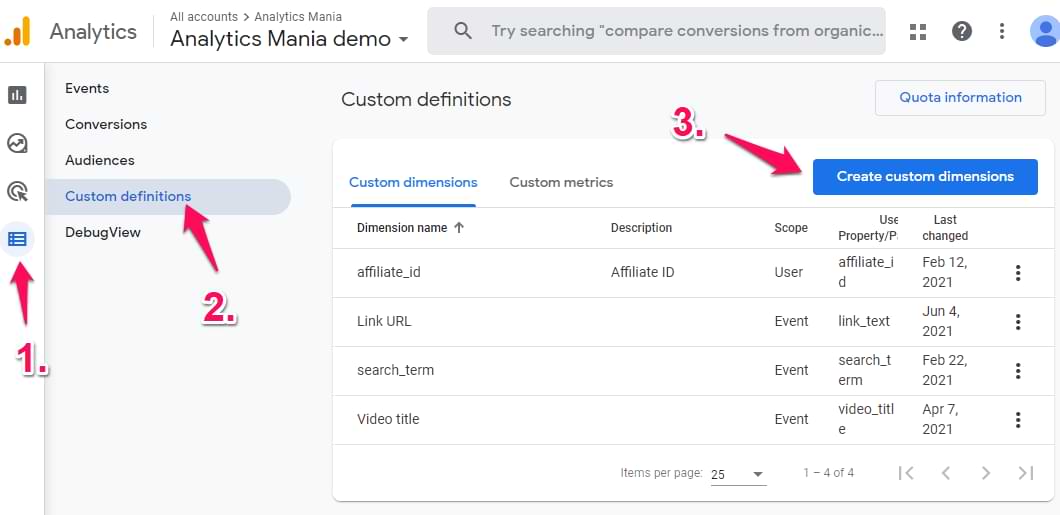
Step One: Access the Admin settings of the Google Analytics account, and go to the “Custom Definitions” in the “Property” column. Here, you will find the “Custom Dimensions” category.
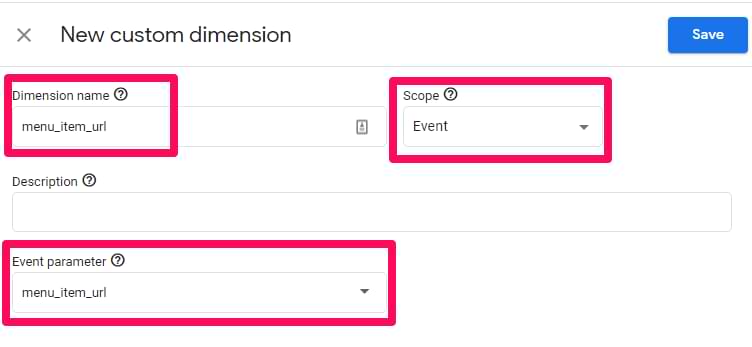
Step Two: Click on ‘+New Custom Dimension’, and fill out the necessary fields like Name, Scope, and Active status.
Step Three: After filling in the details, save your new dimension. The system will then provide a tracking code unique to this specific dimension which you have to add to your website’s code.
Note: Modifying the website’s tracking code may require some technical proficiency or assistance from your website developer to execute correctly.
Once they are accurately set up, these custom attributes will help you squeeze more valuable insights from your data. It provides a more detailed look at user behavior, leading to more effective optimization of your website.
Remember, the right use of dimensions coupled with meticulous analysis can transform the way businesses perceive their audiences, directly contributing to the achievement of more ambitious growth objectives.
Getting the Most Out of Dimensions for Detailed Analysis
The realm of Google Analytics offers a tool known as “dimensions” which are key to performing thorough evaluations and developing actionable insights. They make it possible to segregate and analyze data more efficiently and help to understand how visitors interact with your site.
Using these powerful tools appropriately, you can delve deep into your data and identify trends, patterns, and critical areas of interest that can improve your business strategies. To use dimensions effectively, it helps to have a deeper understanding of their capabilities and process.
Unlocking Dimensions for Thorough Evaluations
Dimensions are characteristics of your data that can be segregated into various subsections. The detailed insights they provide can help to understand user behavior better, and provide a well-rounded understanding of how your website or app performs.
How do you use dimensions to get comprehensive analyses, you ask? The first step is mapping out data points that are of significance to your business. For instance, it could be user demographics, geographic location, or device type. By identifying these data points, you ensure that the dimensions you choose will have relevance to your analysis.
The next step is to apply these dimensions in your Google Analytics account. They can be applied to different reports to ascertain trends, patterns, or behaviors unique to each dimension. For instance, you can apply “city” as a dimension to your audience reports to get a geographical breakdown of your users. This may lead to conclusions on where best to focus marketing efforts.
Lastly, don’t forget to utilize the ability to combine dimensions for a detailed and broader perspective. By doing this, it becomes possible to determine how different dimensions correlate with each other and provide a more profound understanding of your users.
For instance, combining “City” and “Device” dimensions can help determine if users in a particular city prefer using mobiles or desktop for accessing your site. It could lead to decisions on whether to optimize the site for mobile-first or desktop-first experiences.
In conclusion, dimensions are an invaluable tool for in-depth analysis. By identifying important data points, applying them appropriately, and combining them, you can harness the power of Google Analytics to its full potential and develop more targeted business strategies.
The Distinctions Between Dimensions and Metrics in Google Analytics
In the realm of Google Analytics, metrics and dimensions are powerful tools for data analysis. They present data about your website usage and patterns in different ways, enabling you to make informed decisions based on the available data. However, they are not the same and understanding their purpose can make a significant difference in how you use data.
Dimensions and metrics, while vital, play different roles in data analytics. Essentially, these two elements hold different kinds of data, evaluate different components, and offer different aspects of information. Recognizing their distinctions can enhance the precision of your data analysis and the efficacy of your data-driven strategies.
Contrasting Features of Metrics and Dimensions in Google Analytics
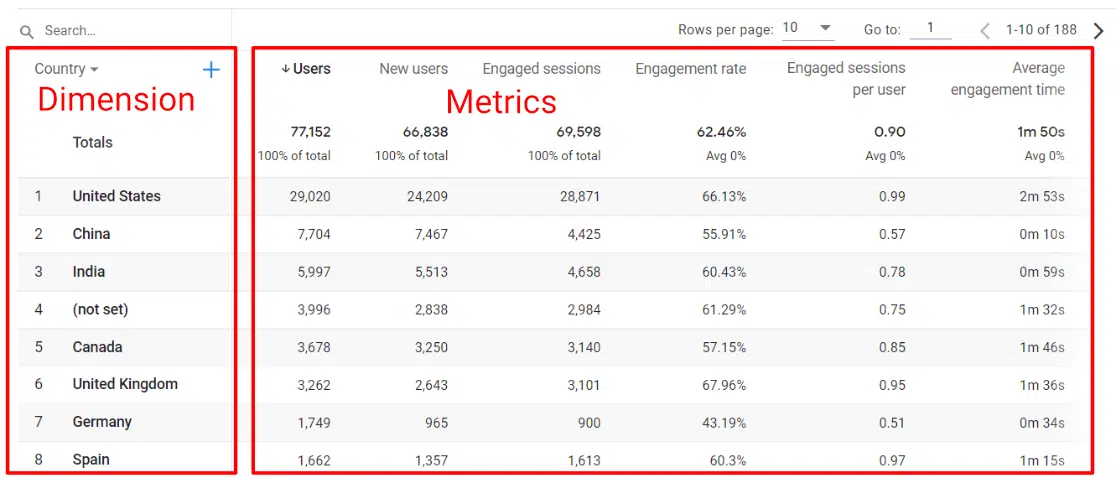
The main distinction between dimensions and metrics is how they represent data. Dimensions are descriptive attributes or characteristics of objects that can be measured, while metrics are individual elements of a dimension that can be measured as a sum or ratio.
- Dimensions demonstrate the characteristics of your data. For instance, the browser, the city, or the page viewed on your website constitute dimensions. These give context to the metrics. Therefore, dimensions categorize, segment, and describe data.
- Contrarily, metrics refer to the numerical, quantifiable data that dimensions produce – for example, the number of sessions, the percentage of new visits, or the number of page views. Hence, metrics present quantitative measurements of the parameters established by dimensions.
Another essential factor to understand is how dimensions and metrics correspond with each other. Each reporting view in Google Analytics comprises a fixed, predefined set of dimensions and metrics. Making sure they make sense when paired together enhances the accuracy and relevance of the data.
In conclusion, dimensions and metrics in Google Analytics are two different, yet interconnected elements of data analysis. Recognizing their differences, their purpose, and how to combine them optimally can significantly enhance your data interpretation skills and elevate your data-driven decision-making strategies.
FAQ: Understanding What a “Dimension” is in Google Analytics
What is Google Analytics 4 (GA4)?
Google Analytics 4 (GA4) is the latest version of Google Analytics, offering advanced features for tracking and analyzing user data.
What is a primary dimension in Google Analytics?
What is a primary dimension in Google Analytics? A primary dimension in Google Analytics refers to the main attribute you want to analyze within your reports. For example, when you view a report on traffic sources, the primary dimension could be “Source” or “Medium.” Understanding what is a primary dimension in Google Analytics is essential for effectively interpreting your data and making informed decisions. By selecting different primary dimensions, you can gain insights into various aspects of your website performance, such as user behavior or demographics. In summary, knowing what is a primary dimension in Google Analytics allows you to customize your reports and focus on the metrics that matter most to your business.
How can you create a custom dimension in Google Analytics?
To create a custom dimension, you can go to the “Admin” section of your Google Analytics account and select “Custom Definitions” under “Property.” From there, you can create a custom dimension.
What is a secondary dimension in Google Analytics, and how is it used?
A secondary dimension is an additional attribute that can be added to a data table to provide more detailed insights about your primary dimension. It helps you analyze your data in more depth.
What is the primary dimension in Google Analytics?
The primary dimension in Google Analytics is the main attribute or criterion by which data is organized in your reports. For example, “Page” or “Source/Medium” could be primary dimensions.
What is the difference between dimensions and metrics in Google Analytics?
Dimensions are attributes that describe data, while metrics are quantitative measurements that provide insights into user interactions and website performance.
How can you set up custom dimensions in Google Analytics?
Custom dimensions can be set up in the “Admin” section of your Google Analytics account under “Custom Definitions” within the “Property” settings.
How can custom dimensions and metrics be used effectively in Google Analytics?
Custom dimensions and metrics allow you to tailor your analytics to track specific user interactions and data that are relevant to your business goals.
Google Tag Manager is a tool that allows you to manage and deploy tracking tags on your website. You can use it in conjunction with custom dimensions to collect specific data.
What is a hit-level dimension in Google Analytics?
A hit-level dimension is an attribute that is associated with individual interactions or “hits” on your website, such as pageviews or events.
How is data organized in Google Analytics to effectively analyze user behavior?
Data in Google Analytics is organized by dimensions and metrics, which help you gain insights into how users interact with your website.
What is a custom dimension in Google Analytics, and why is it useful?
A custom dimension in Google Analytics is an attribute that you can define to collect data that is not tracked by default. It is useful for tracking specific information that matters to your business.
What is a custom metric in Google Analytics, and how does it differ from a dimension?
A custom metric is a quantitative measurement that you can define to track numeric data. Unlike dimensions, which describe data, custom metrics quantify it.
What is the difference between Universal Analytics and Google Analytics 4 (GA4)?
Universal Analytics is the older version, while GA4 is the latest, offering more advanced tracking and analytics features.
How can you create custom dimensions and metrics in Google Analytics?
Custom dimensions and metrics can be created through the “Admin” section in your Google Analytics account by selecting “Custom Definitions” under “Property.”
What are user-scoped custom dimensions in Google Analytics?
User-scoped custom dimensions are attributes tied to individual users, allowing you to track specific data related to user behavior.
How do you set up custom reports in Google Analytics?
Custom reports can be created by selecting “Customization” in the Google Analytics menu and then choosing “Custom Reports.” You can configure these reports to display the data you want.
Can you provide examples of custom dimensions that businesses commonly use in Google Analytics?
Common custom dimensions include user roles, product categories, subscription levels, and custom user IDs.
What types of metrics are available in Google Analytics?
Metrics in Google Analytics include pageviews, bounce rate, average session duration, and many more. They help you quantify user interactions.
What is the role of a dimension in a custom report within Google Analytics?
Dimensions are used to organize and describe data in custom reports, providing context for the associated metrics.
How does Google Analytics collect data effectively, and what are some best practices for utilizing its features?
Google Analytics collects data by tracking user interactions on your website. To utilize its features effectively, it’s essential to set up custom dimensions, metrics, and custom reports that align with your business goals.
© PhoenixProject, with full or partial copying of the material, a link to the source is required.


Comments: 0