The federal network of quick loans "Centrofinance" operates in the microloan market of the Russian Federation in 72 regions of the country. "Centrofinance" is your reliable support and reliable financial assistant.
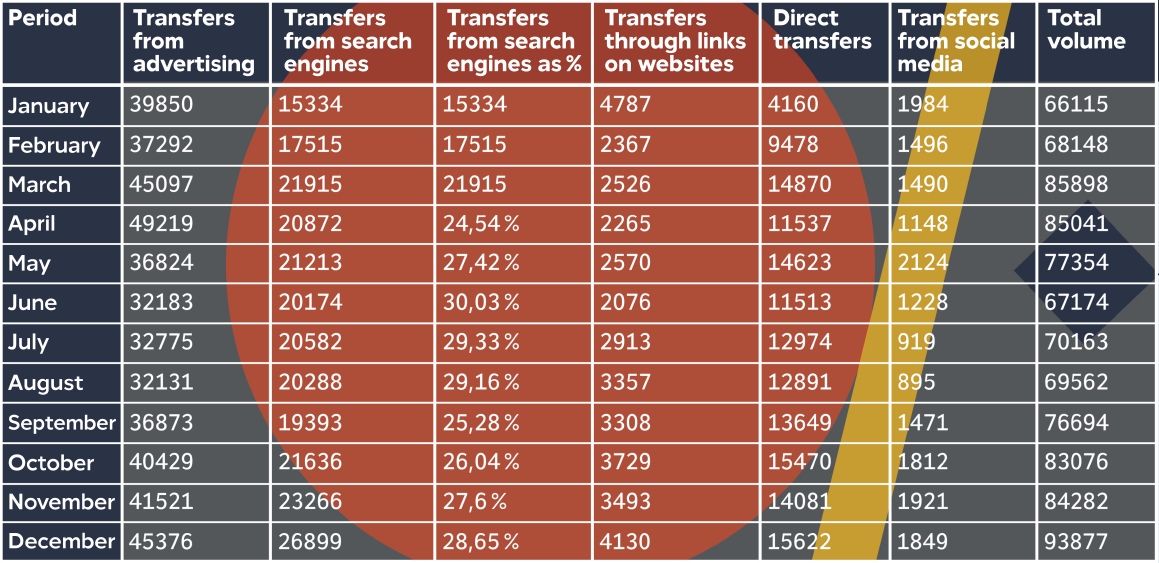
In January 2018, traffic was received from the following sources:
contextual advertising
search engines
links on websites
direct transfers
social media
A total of 67,103 visits
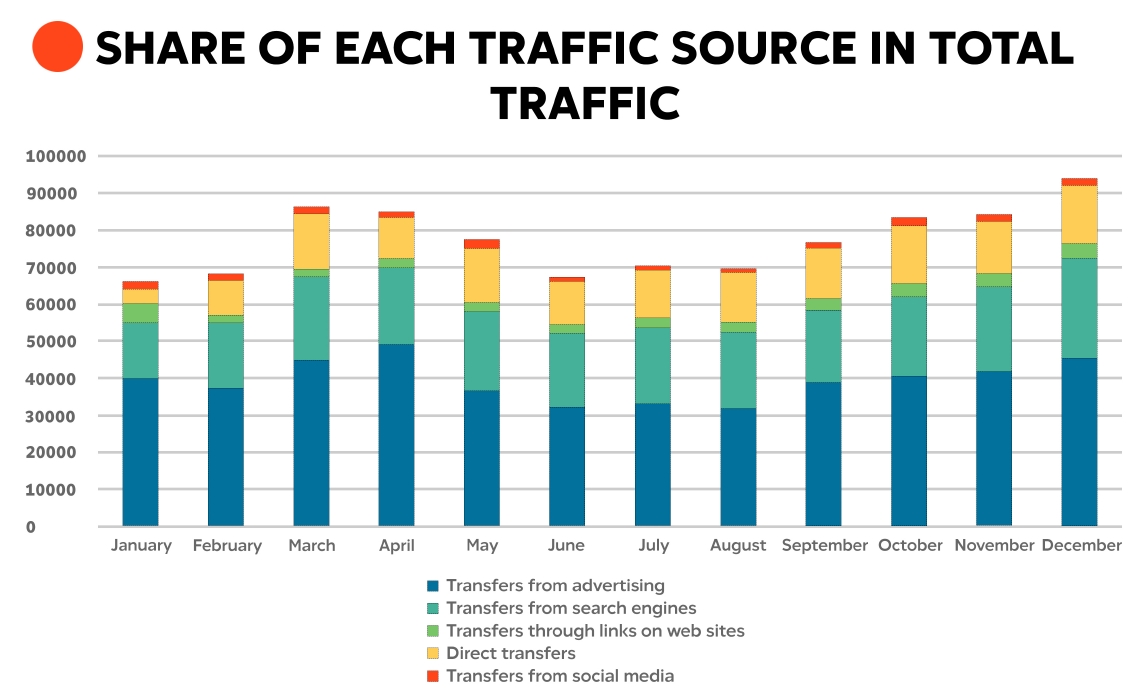
For March 2018, traffic increased by almost a third to 87,894 visits (an increase of +30.98%).
Judging by the graph above, contextual advertising is the main source of traffic, while search engines are the second largest source of traffic.
The highest share of traffic from search engines in total traffic from all sources was achieved in June, at 30%.
TRAFFIC FROM SEARCH ENGINES
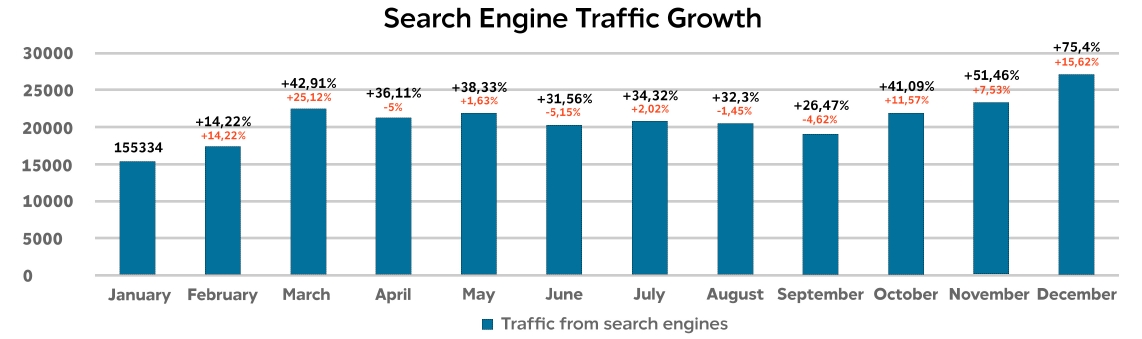
Tin January 2018, the volume of traffic from search engines was 15,334 visits.
As a result of the work done, after almost a year, the volume of traffic has more than doubled by half (in November it was 23,226 visits and in December it was 26,889 visits). The increase of traffic was 11,555 visits (+75.4% increase).
The maximum number of visits (1,232 visits per day) occurred on the date 12/10/2018.
The percentage data highlighted in black shows an increase in traffic relative to January 2018, while the percentage data highlighted in yellow shows the trend in traffic betwee months.
SEARCH ENGINE TRAFFIC GROWTH DYNAMICS
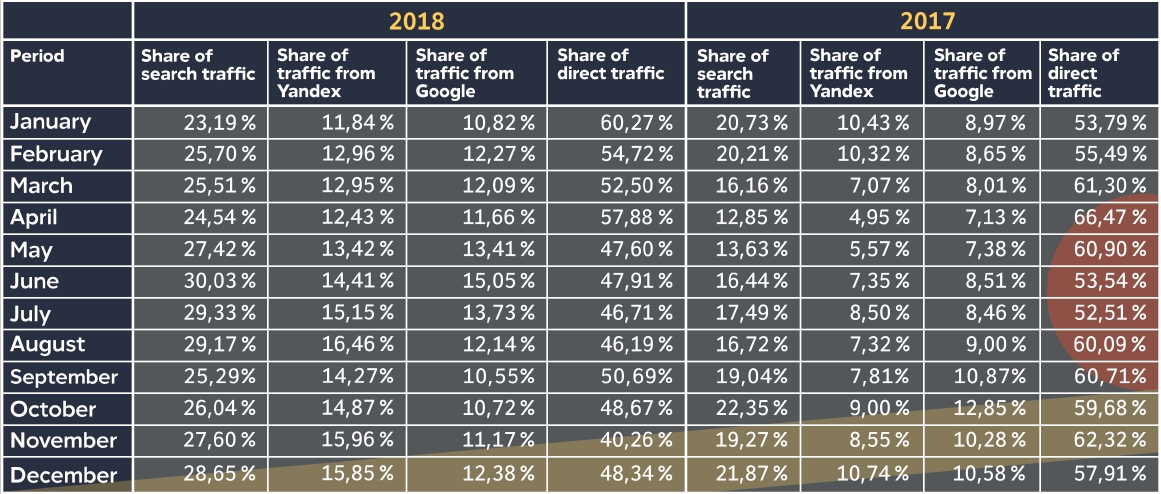
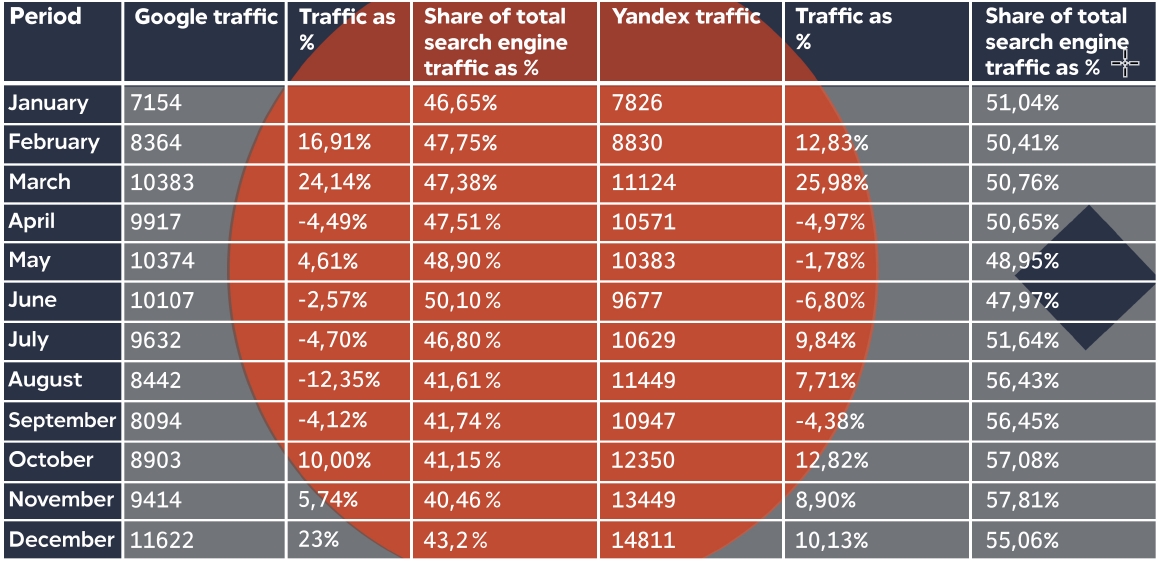
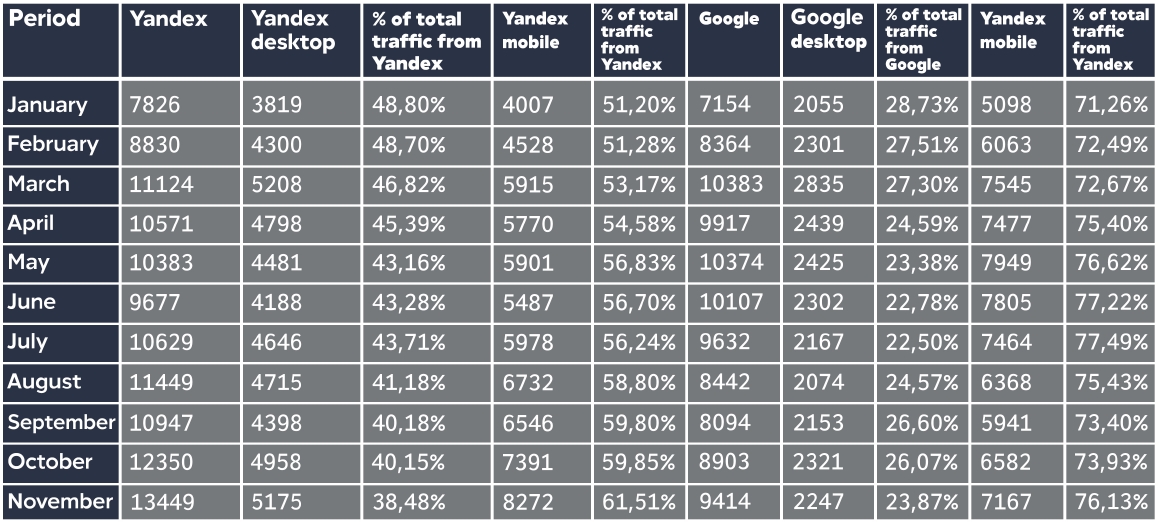
TRAFFIC FROM GOOGLE AND YANDEX SEARCH ENGINES
CONCLUSIONS ON TRAFFIC FROM GOOGLE:
The biggest increase in traffic from Google search engine was observed in March and May 2018.
The average increase in traffic for the 3 months (October, November and December) was +12.91%.
In November, October and December, there is a noticeable upward trend in traffic volumes due to the work being done to improve the website and make it run smoothly. This trend of increasing traffic will continue.
CONCLUSIONS ON TRAFFIC FROM YANDEX:
From the very first month of work on the project until December, there was a trend of significant growth in traffic from the Yandex search engine.
In February, there was a 12.82% increase in visits, with a steady further increase in visits over the following months (compared to the beginning of the year, with the exception of off-season periods).
The highest number of visits (14,811 visits per day) was achieved in December, with 7,826 visits in January.
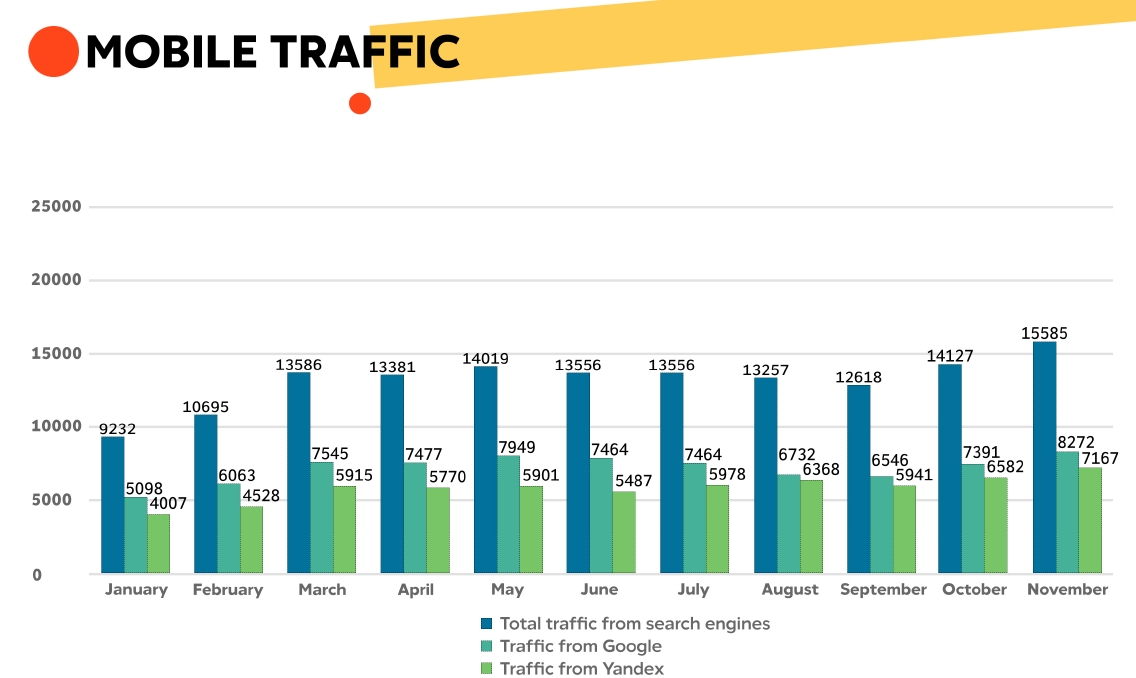
MOBILE TRAFFIC GROWTH DYNAMICS
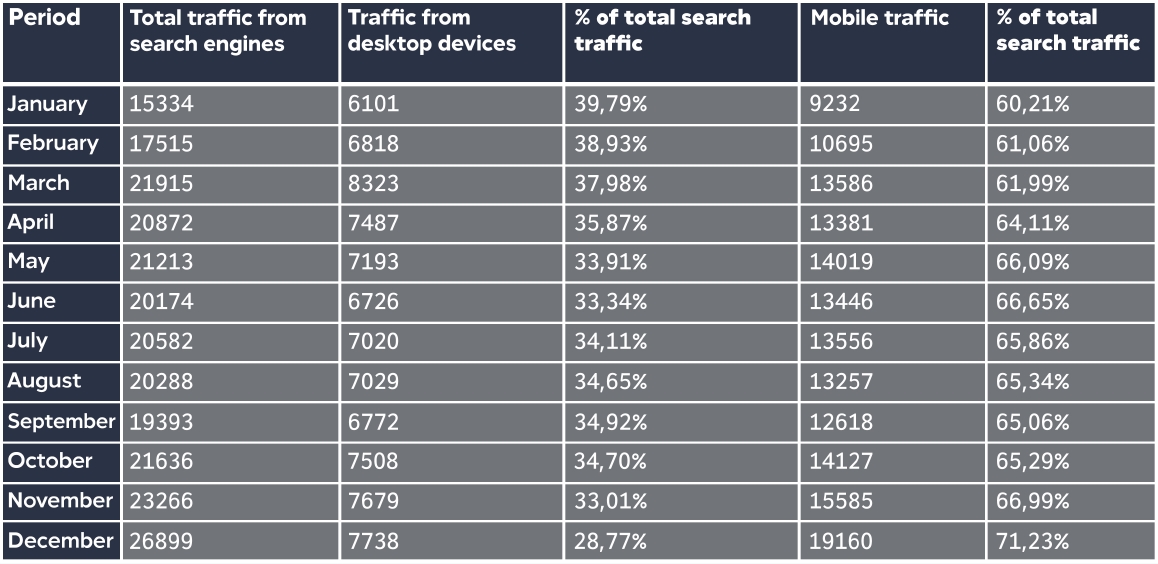
SHARES OF TRAFFIC FROM MOBILE AND DESKTOP DEVICES
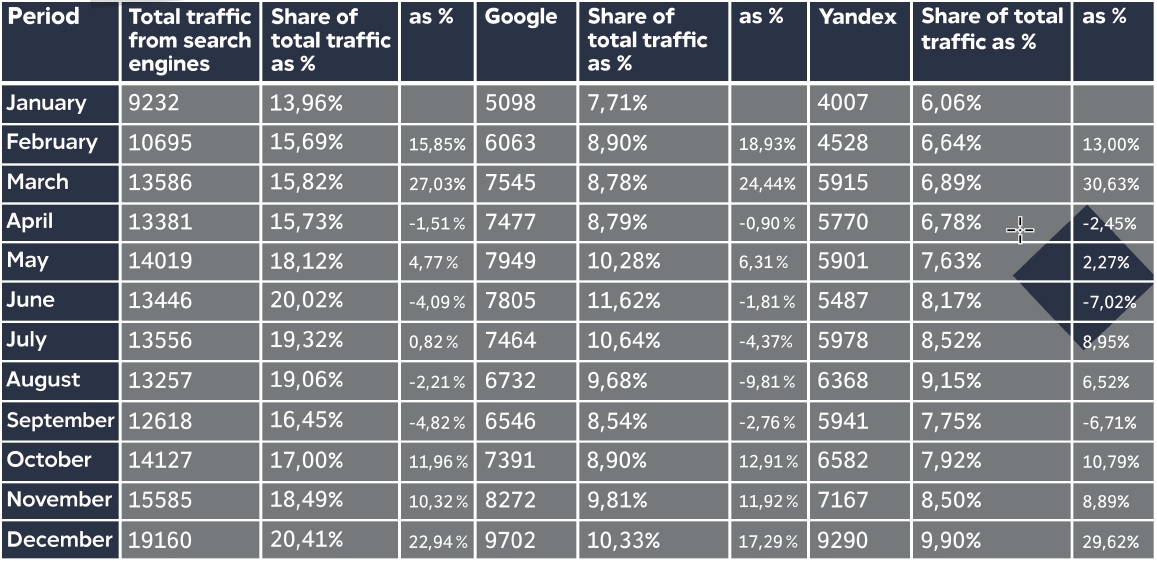
SHARES OF TRAFFIC FROM MOBILE AND DESKTOP BY GOOGLE AND YANDEX
MOBILE TRAFFIC
CONCLUSIONS:
As the share of mobile traffic is gradually increasing every year, we are facingan important challenge: to ensure that the website loads as quickly as possible on mobile devices, with mobile web pages displaying content correctly on all devices regardless of the version of web browser and operating system used.
This year, the mobile website load speed decreased slightly from 3.8 seconds in May to 6.1 seconds in December. Consequently, the overall page load speed score dropped from 96/100 to 54/100.
This website behavior is explained by some issues on the hosting provider and server side.
However, the mest important reason for the slow performance of the website is the need for continuous optimization activities because one-off optimization activities are not sufficient to make the website competitive.
With more and more competitors investing in mobile technology (developing mobile apps, mobile versions of websites, optimizing content for easy display on smartphones and tablets), it is necessary to be proactive and make every effort to optimize the website for mobile.
However, despite the above, we have seen a marked increase in mobile traffic volumes.
While in January 2018, mobile traffic was 9,243 visits, in December, it was 19,160 visits, an increase of +107ю29%.
Google search engine: traffic in January 2018 was 5,108 visits, while in December it reached a value of 9,702 visits, an increase of +89.03%.
Yandex search engine: traffic in January 2018 was 4,008 visits, while in December it reached a value of 9,290 visits, an increase of +131.78%.
It follows from the results that search engines have given us a positive signal to continue our mobile optimization efforts. Subsequent mobile optimization initiatives will only improve the results.
However, the current situation means that we should pay more attention to mobile traffic and put more effort into increasing the volume of mobile traffic.
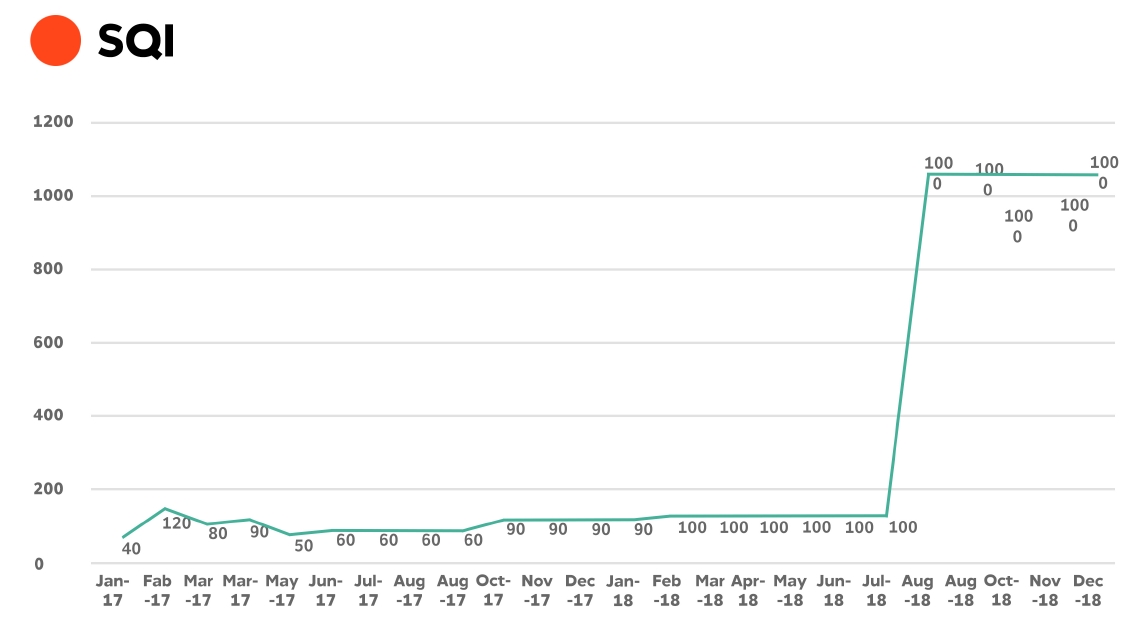
CONCLUSIONS:
On 31 August 2018, Yandex representatives announced a new metric to replace TIC. Thus, a new metric, the Site Quality Index (SQI), was introduced. Since the first days of introduction of the new metric, the SQI of centrofinance.ru was 1000, and this figure remains unchanged until the current date. Since there have only been two updates and the SQI value has not changed since then, it is too early to draw any conclusions. We need more time and information about the SQI, in particular about what the data on this metric is to evaluate the website.
Recent research suggests that TIC is partly a function of traffic volumes. As website traffic volumes have been increasing in the past months, it can be assumed that TIC will increase in the coming updates.
The unfairness of how TIC rates websites can be judged by comparing the website with competitors. The recently introduced SQI metric is more accurate and provides a good indication of how effective search engine optimization work is. Among the competitors with the highest TIC scores, MoneyMan ranks first with 4,400 points, while MigCredit comes in second with 3,300 points.
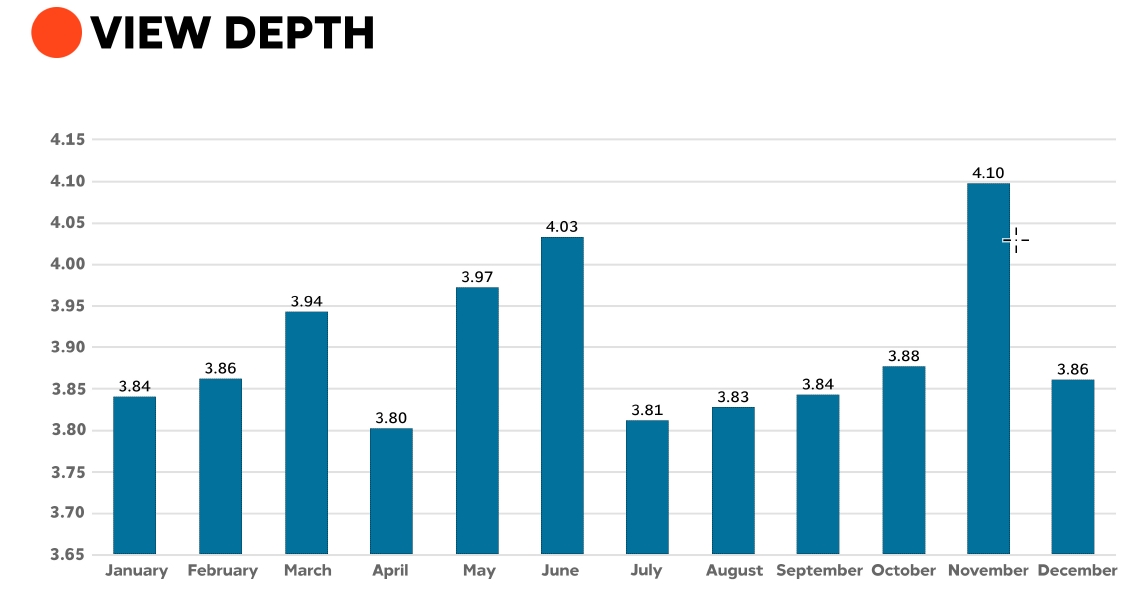
View depth is one of the most important behavioral factors considered by search engines when ranking websites. View depth refers to the number of website pages opened by the user during one visit. View depth indirectly indicates to what extent the website is interesting and useful for the visitor.
For comparison, we used an average View depth per website.
As can be seen from the graph, there was an increase in View depth value for the website in November (compared to January). In fact, users viewed 0.26 more pages on average. Given that the website has a large number of pages with a simple structure, this increase is a positive signal.
Thanks to the addition of the Blog section as well as other website optimization work (including a restructuring of the Promotions section), View depth value increased markedly (4) from 2.8-3.4 in the previous year.
December, there was a slight drop in View depth value, reflecting the upcoming festive season, when people are keen to get their money out as quickly as possible and spend less time getting information.
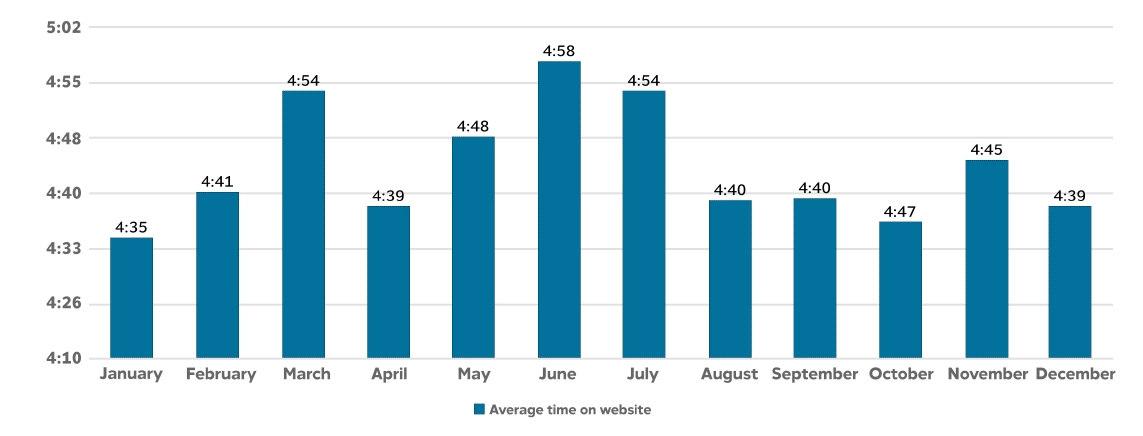
AVERAGE TIME ON WEBSITE
Another important behavioural factor is the average time on website, which reflects how much time visitors spend on the website.
As for transfers from search engines, the average time on the website in January 2018 was 4 minutes and 35 seconds, while in November it rose to 4 minutes and 45 seconds, an increase of 3.63%.
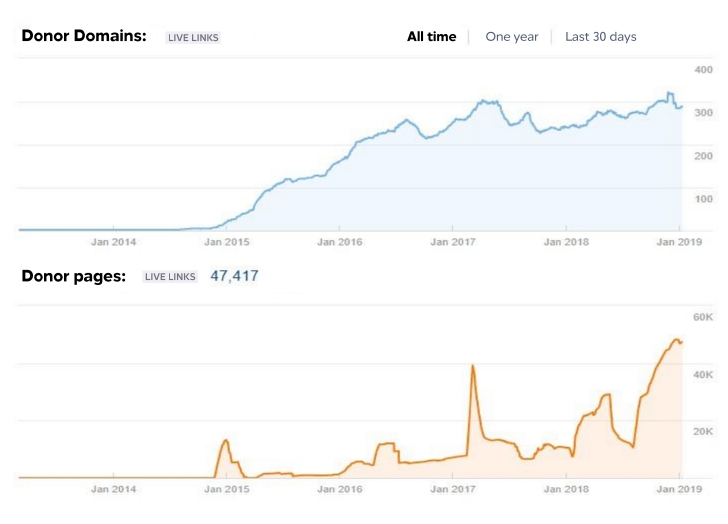
LINK WEIGHT
According to Ahrefs, the website had 270 donors on 1 January 2018
As of 28 December 2018, the number of donors has increased to 300
This corresponds to an 11% increase in the number of donors
At the same time, there was a significant increase in link weight from 10,000 to 47,500.
This growth was due to the connection of lead generators as well as due link placement on online resources, catalogs and social media.
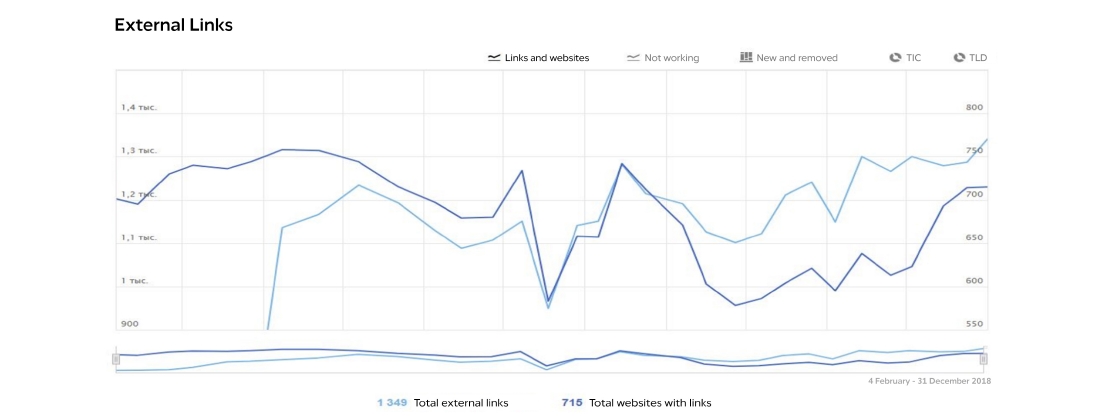
LINK WEIGHT
ACCORDING TO YANDEX:
In the months following August, link volume stabilised, and link growth continued, according to Yandex.Webmaster
While there were 701 links in February, as of December 24, there were 714 donors with a total of 1,287 links.
CONCLUSIONS:
The positive link weight dynamics have been observed for the following reasons:
Regular publication of textual content on trusted sites
Work on catalogs
Connecting lead generators
Use of social media platforms
Due to the above-mentioned activities, as well as the growth of natural links, a steady increase in link weight and the number of high-quality donors has been achieved so far.
The sharp increase in link growth according to Ahrefs raises some concerns. Further analysis is desirable to address the possible issue of competitor influence on the website’s link weight.
OVERALL CONCLUSION:
Overall, 2018 proved to be a year of great change – and at the same time great achievement – regarding this project.
We succeeded in:
Increase total website traffic by 41%
Increase search engine traffic by 75.4%
Increase of Viewing depth index by 0.26
Increase average time on website index by 3.63%
Increase quality link weight (however, link weight analysis has to be done to rule out the possibility of competitors’ influence)
Increase number of pages indexed in Yandex by 48.09%
Increase number of website pages indexed in Google by 180.56%
Case results SEO promotion of project Centrofinance
+40%
total traffic
+75%
search traffic
+0,26 page
viewing depth
+3,63%
average time
DO YOU WANT IT TOO?
Leave your contacts here. We will call you back, answer your questions and prepare an offer tailored to your goals and objectives.
Our Services
We specialize in promoting your business with an emphasis on learning more about your web project and saving you money
SEO
A full cycle of website performance improvement: increasing traffic and conversion rates, enhancing usability and website quality in general
Setting up Google AdWords for the YACHT CONTACTS project
Creation of a quality company with the involvement of target users. The company should contain only relevant luxury phrases and premium customer segments. Only all near-targeted or weakly converting queries should be excluded.